
The point-in-time count of homeless persons in Topeka took place on January 23rd. This one day event produces a snapshot of the individuals in our community experiencing homelessness as defined by Housing and Urban Development. This data is used to support federal funding for the Continuum of Care Initiative. In 2018 the Topeka Rescue Mission saw 419 people experiencing homelessness. In 2019 that number jumped to 441. 16% of the homeless population in Topeka was under 18, for a total of 69 persons under 18. Overall the numbers of homelessness in Topeka increased from last year.
“The point-in-time count helps us to identify those people in need and to attain the resources that we need to help them,” said Corrie Wright, Division Director of Housing Services for the City of Topeka. “We want to thank all the volunteers who helped us with the count and who are helping to make our community better.”
The information gathered during the point-in-time count helps the City of Topeka understand the face of homelessness in the community so that services are meeting the needs of homeless persons. This count also helps to raise public awareness surrounding issues with homelessness and measures the community progress towards preventing and ending homelessness.
The City of Topeka’s Housing Services Division has totaled the numbers from this year’s point-in-time count. This one day event produced a snapshot of individuals in our community experiencing homelessness.
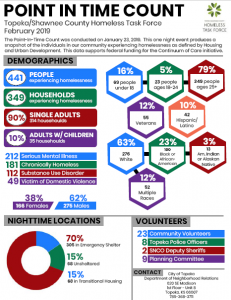
• 441 People experiencing homelessness.
• 349 Households experiencing homelessness.
• 212 individuals have a serious mental illness.
• 181 individuals are chronically homeless.
• 70% of people were in an emergency shelter, 15% were in transitional housing and 15% were unsheltered.
Forty-two individuals helped with the point-in-time homeless count, including 23 community volunteers. Below is a chart that details and compares the numbers from 2018 and 2019.
2018 2019
| People | 419 | 441 |
| Households | 322 | 349 |
| % of single adults | 88 | 90 |
| % of adults with children | 12 | 10 |
| % of youth households | 7 | 16 |
| % of veteran households | 19 | 12 |
| People with serious mental illness | 183 | 212 |
| People who are chronically homeless | 153 | 181 |
| People with a substance abuse disorder | 69 | 112 |
| People who are victims of domestic violence | 34 | 49 |
| % in an emergency shelter | 66 | 70 |
| % in transitional housing | 17 | 15 |
| % unsheltered | 15 | 15 |